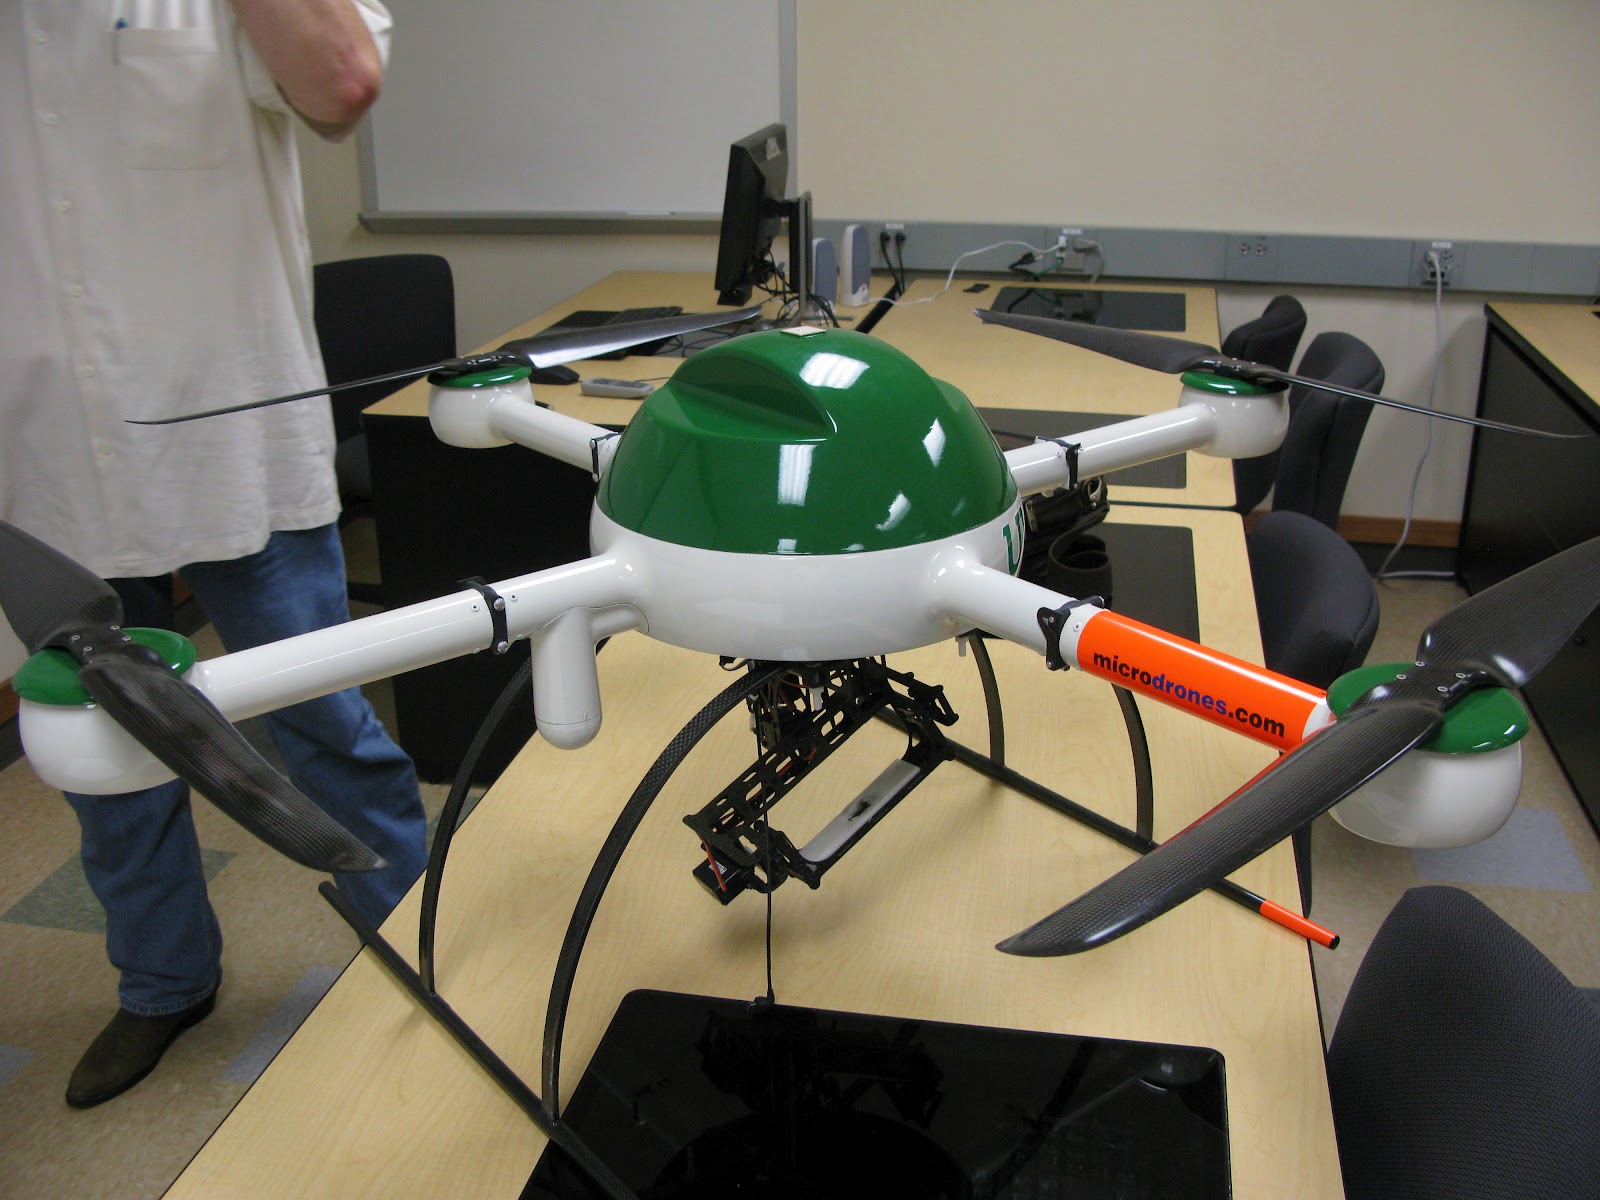
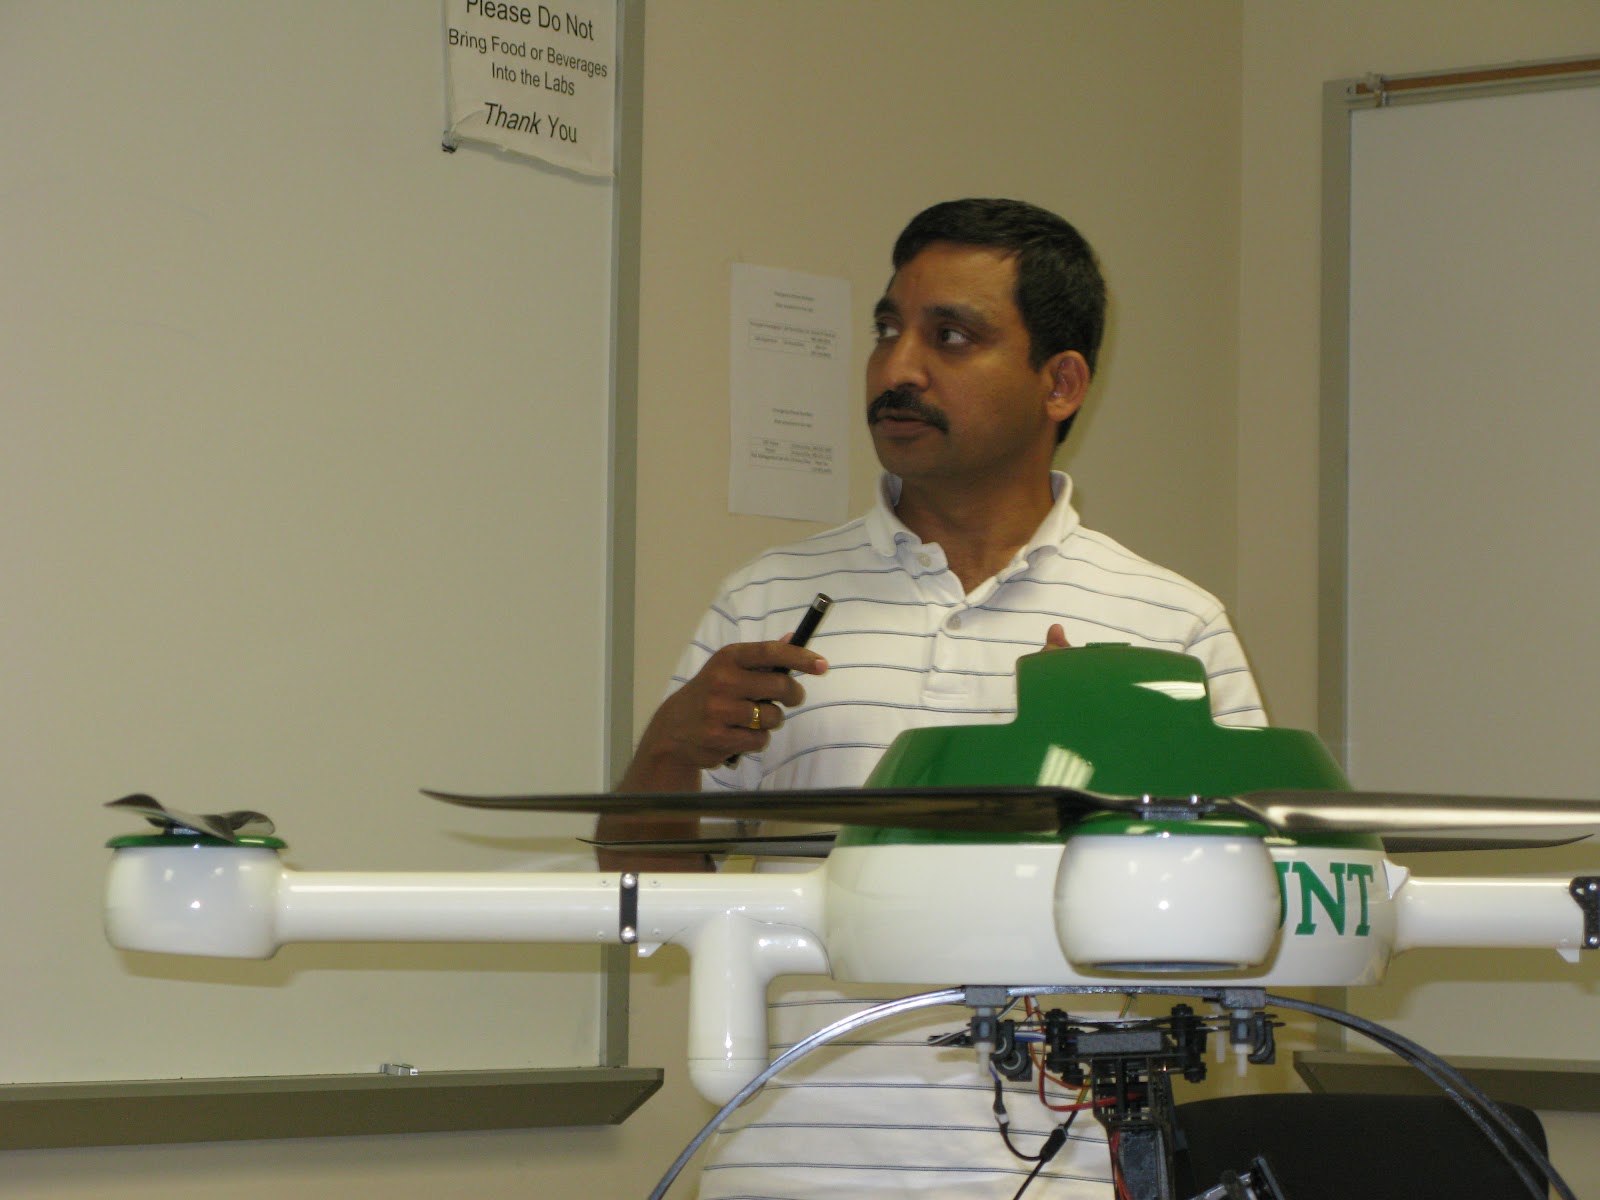
Thursday, July 19, 2012

Day 26,27,28 and 29
Dr. Rudi Thompson gives RET participants a tour of EESAT  Building

The atrium in the EESAT Building
This week we have been quite busy putting the finishing touches on our deliverables for our projects. We are required to submit 1. Poster 2. Research Paper 3. Presentation 4. Lesson Plans 5. TechFest Activity 6. Group Poster

On Day 29 we also took group photos wearing our RET shirts and profile shots as well.

Friday, July 13, 2012

Day 25
RET Participants, Dr. Acevedo, Dr. Hunter and visitors from Universidad Autonoma del Estado de Mexico
Today the RET group met with visitors from Mexico. Dr. Hunter has been doing some work with the Universidad Autonoma del Estado de Mexico and during their visit to the United States, he wanted to expose them to some of the work being done in the RET project. We talked with them about how their education system is designed in Mexico and shared how ours is designed in the U.S. We then discussed the similarities and differences as well as how we could possibly have a WebLab session with one of their middle or high schools.

Thursday, July 12, 2012

Day 23 & 24
Dr. Kuruvilla John presented on Air Quality

Dr. John gave a very enlightening presentation regarding some of his research in air quality studies. Dr. John presented numerous examples on how the equipment they have installed in the field has been able to correllate changes in air quality in certain geographical areas with current events.

Kim and I spent time working on documentation relating to our literature review and final paper. We also conferred with Dr. Bruce Hunter to discuss the arcGIS siftware installed on the systems in his lab in the EESAT building. Kim was able to install the arcGIS software on a lab computer after getting administrative permission granted from Jason. She was able too install the arcGIS explorer and we were then able to look at some of the data files and assign different colors to the files. Afterwards, the scale was used to measure distance and then convert the distance into equivalent carbon emissions. It turns out that there is a carbon footprint calculator on the epa.gov website that will calculate the carbon footprint for you if you entered the mpg of the vehicle used and distance.

Tuesday, July 10, 2012

Day 21 & 22

Kim and I met with Dr. Huang and Jason today to discuss data for the Rideshare project. We will continue to collect data from peers and try to convert the data to text format and then remove the needed sections and save back to .gpx format. We will then be able to look at trips of data and a better analysis can be made.

Dr. Bruce Hunter with GPS system

Our RET group attended a seminar on the main campus in the Environmental Science Building. The seminar was conducted by Dr. Bruce Hunter. The topic was Geographic Information Systems (GIS) .

Friday, July 6, 2012

Day 20 - WK 4


Lesson Plan Development day.  I have corrected all the suggestions that Sharon made and created an activity sheet lesson for the RC car.  Watched several videos to present the lesson concepts for teachers who are in flipped and PBL classrooms.  Got topofusion.com demo version put on UNT computers for us to try as a GIS program.  Looked online at EPA for carbon footprint lessons. Observed the young vultures outside our windows

Thursday, July 5, 2012

Day 19 WK-4

David Hunter - Presenter
After recovering from the July 4th festivities,  David Hunter provided a comprehensive presentation on Water Quality and some of the programs and research that is underway in Denton as well as other areas in the state of Texas. David did say schedule permitting he would be able to come to the schools and speak on his areas of specialty including weather.

Mr. Hunter is in the U.S. Navy, a certified meterologist and is currently enrolled in the graduate program at the University of North Texas.
Day 19 - WK 4

This morning I looked at the NY Times article on Ridesharing apps today.  It had most of the same ones we had been looking at.  Joyride was a new one, and it connects people through facebook, which is very interesting.  I also started updating my lesson plan with the suggestions Sharon gave me.  I was looking at the requirements and the area it would fit if I were to try and publish it on tryengineering.org.  We had a seminar in water quality presented by David Hunter I also looked at edmodo, a site which is a social media site for teachers, with lots of resource ideas to connect teachers and students online.  I researched and looked up literature articles on liability issues and casual carpooling, I want to find out what the social aspects of liability are.  I found a couple articles, one that had surveys of casual slugging in Houston, very interesting.

Tuesday, July 3, 2012

Day 17 WK-4
Quadcopter
Dr. Sam Atkinson and Dr. Thompson
Dr. Namuduri - Presenter
Today the RET Team attended presentations from Dr. Sam Atkinson and Dr. Namuduri. Dr. Atkinson provided updates on some of the research he and his group are engaged in at the university. He brought the quadcopter and showed a video clip to demonstrate some of the capability the drone provides his research team.

Dr. Namuduri provided updates on research he and his team are doing as well. Dr. Namuduri's research involves autonomous systems. These robots should have the capability to operate alone, make decisions, and interact with others.

Kim was able to locate a software package called Topofusion that will allow overlaying of trajectories with GPS data. Each file could be represented by a different color therefore making common routes very clear on  Google maps. The trial version of this software is free and can be used without expiration if you can stand the watermark logo that's posted.


Monday, July 2, 2012

Day 16 WK-4
Dr. Acevedo -Facilitator

Donn Arnold - Presenter

Jennifer Williams - Presenter

Dr. Wasson - Presenter
The RET group attended a presentation concerning WebLab. WebLab is a program Donn Arnold and Jennifer Williams have been working on with the guidance of Dr. Acevedo and Dr. Wasson. The WebLab program is designed to reach out to middle and high school students and inform them about engineering activities and careers by bringing video technology into their classrooms with presentations from college students about projects they are currently involved in developing. The presentations are interactive where students can see and talk to the presenters and vice versa.


Day 16 - WK 3

This morning came in and began looking at some of the reference resources that Dr Wasson suggested for societal issues related to technology and ride-sharing.
Took an online carbon footprint calculator designed for high school students.  Very good site, a little lengthy but it has really good application to students daily lives.  http://footprint.stanford.edu/calculate.html  this site is part of the International Carbon Footprint Student Challenge.  Students can compare their data to the US average, to other students around the globe in real-time and to other countries averages and look at ways to re-calculate and reduce their own.  I am going to add this component to our lesson plan as an introductory awareness activity to the big picture of global climate change and one planet.  Spent the afternoon looking at different GIS applications, trying to learn how to overlay different GPS data and maps to get one visual image.  I am going to try GRASS GIS, it is a free program and seems to be pretty flexible.  I also am looking at arcGIS, but it is expensive to have the entire software.
Day 15 WK-3
Karl Gscheidle, Elizabeth Sink - Presenters

Zac Bunn, Jose Guerrero, Lori Wolf - Presenters

Bruce Hunter - Visitor


Friday was mid-term presentation day for each of the RET groups. All morning was consumed with group presentations.

Wednesday, June 27, 2012

Day 13 and 14 WK-3

Kim and I continued work on our literature review today. We met with our mentor Dr. Huang and decided to catergorize our research as societal, algorithms/technology, apps, carbon footprint, defining GPS. We will not only look at data being collected by out RET team but also take a sample of the data collected from taxi's in Shanghai. The RET team met in the library for additional literature review research as well.

Tuesday, June 26, 2012

Day 11 WK-3 and Day 12 WK-3

We spent time reviewing our literature and getting a better understanding of how Google Earth works. Took time to explore many of the features rarely used in everyday applications. Turns out that Google Earth has a lot of powerful features built into it.

Several of the GPS-31 trackers exhibited problems that we seemed to clear up by reformatting the SD card and resetting the complete unit.


Dr. Thompson went to Maryland and took one of the GPS trackers with her to gather GPS data. We were so excited about the data obtained from the unit but upon inspection no data was captured and written to the data card. I had Jason look at the unit to determine if he could figure out if any issue was resident.

Friday, June 22, 2012

Day 10 - WK 2

Today we were working on developing a fun and interactive lesson plan to help engage the students and encourage and get them excited to collect data understand how to look at data.  
I had the idea to have students take rc cars outside equip them with GPS sensors and have students drive a mock city setup to complete a set of tasks. To incorporate this with my Physics course I want to have the students first complete the activity using measurements by hand and vector addition and look at distance and displacement, then have them go back and create GPS data of their tasks and look at the data gathered on the GPS through numerical and GIS files and calculate their carbon emissions on the trip. I want students to then go back and look to see if there was a way to reduce their trip, and their emissions.  


The project part will be for the teams to collect GPS data for 2-5 days and compile it into one file possibly using GPSbabel.  I spoke with Jason and he is going to help us develop a code to turn the files into XML files that can then be uploaded by multiple team members and overlay each person's track in a different color to visualize and compare their routes to create a model and presentation about ways to calculate and create rideshare opportunities within their school, or community, or for some students see if they can find a better more effective bus route.
The next step for me is to research different cities maps to determine what cities might work best to scale up and recreate its basic highway system.  Also look at different rc cars and costs and GPS costs to implement this in my classes.  I need to run more tests with the rc vehicle to determine how accurate and to what extent we can collect data with few errors.  I actually saw a sight where students used GPS to write their names once the data was uploaded into the GIS application.
Day 9 - WK 2

Brought in an RC vehicle because the snap rover did not have a high enough rate of speed to log on the GPS.  The RC car was able to log a significant amount of data with a surprisingly few outliers.  The data actually was able to track the vehicle down one side of the sidewalk and back up the other side.  We were also able to park in a parking spot and back out.  We collected the data then imported it into Google earth, which showed our path very precisely, with only a few small outliers.  We also drove the rc car back into the building, up the and around the vending area outside the Ee department.  You can see in the images our path and even our detour to the vending area, there are some greater deviations from the actual track once in the building, but still a fairly good representation of our track.


We had a morning meeting where we discussed the requirements for the research paper and presentations.  Midterm presentations will need to contain most of our literature reveiw, methods and any results we have obtained.  IEEE.org actually has a paper format for teams interested in possibly publishing thier work after RET is completed.

In the afternoon I found a calculation for converting car mileage into emissions quatnities.  I was able to obtain this data from the Sightline Institute.org.  The following table shows the values based on car size.


vehicleconversion factorlbs CO2 per mile traveled
small0.59
medium1.1
SUV1.57


Afternoon lecture on wireless senesor networks and the TEO - Texas environmental Observatory by Dr. Fu and Dr. Acevedo.  


Thursday, June 21, 2012

Dr. Fu

Dr. Acevedo

Day 9 WK 2


We ended the day with presentations from Dr. Fu and Dr. Acevedo. Dr Fu enlightened us over his research in Wireless communications and Sensor Networks while Dr. Acevedo provided information on the Environmental projects using the technology presented by Dr. Fu.

After finding we were not able to collect data from the RC Snap Rover because of minimum and file size settings on the GPS 31, Kim brought her radio controlled truck. We were able to put the tracker into the truck and drive through the parking lot and along the second floor at Discovery Park. We were able to collect some good data by making the aforementioned modifications. We will analyze the trajectories  and document the results later this week.

Wednesday, June 20, 2012

Day 8 - WK 2

One of our GPS devices is giving off corrupted files so we worked to reset the GPS device, it seems to a bad formatted data card.  We have now been collecting data for 8 days.  Two of our GPS participants are now ridesharing, so we will be giving a device to another teacher.   Worked on the lesson plan today then we went to the library for research time after lunch.  We want to design a PBL, project based lesson for my students to work in teams, collect GPS data through various devices.  The first step for students will be to look at the benefits of ridesharing and the inhibitors to its success and discuss as a class.  I want students to become familiar with GPS and data collection and how it is processed by doing a geocaching activity with vectors and data collection. Research ridesharing techniques in various cities, the social issues of ridesharing, methods used to determine the best routes and how GPS calculates your routes.  Students will then develop a model and plan to reduce the carbon footprint from transportation and promote ridesharing in their school and community using their data results to support their model.
At this point we have no knowledge of how GIS could be incorporated to our project.  We do not have any data patterns other than looking at our data in lat/lon by date and time or in Google earth or on a map.
 Found articles over the social aspects of ridesharing and a website with research and connections for dynamic ridesharing  dynamicridesharing.org.  Found an interesting atricle that noticed a social pattern that women are more likely to ride share unless it was with a stranger. Men were more likely to rideshare with a stranger but in total it was less than 20 adults total willing to rideshare with a stranger. This was in the article Leveraging Social Networks to Embed Trust in Rideshare Programs. Another article actually had a formula they used to calculate CO2 emissions,the article Estimating the environmental benefits of ride-sharing: A case study of Dublin has several formulas that could be useful as we move forward to find a method to turn our distances traveled for each GPS data track into carbon footprint calculation and as well as a practical format that students and children at Techfest will understand.  One example might be how many trees it takes to absorb your CO2 emissions for a time period.


This is a picture of Jesse's track around the second floor of Discovery Park walking after our snap rover data collection failed today. Will bring in a faster RC car to attempt data collection again.


Day 8 Week 2

Kim and I test drove the rover through the building to see if we could collect some tracking data via the rover. It appears that the speed of the rover is not sufficient to trigger any readings on the GPS device other than the initial location of Discovery Park. We repeated the test with the same GPS unit and walked the same path and did collect data. We will look to repeat the test at a later time using a faster remote controlled  rover/vehicle.

Jason mentioned we will use Excel to look at small segments of data to determine/find common trajectories. Using this algorithm, a software program may be written to use on larger amounts of data depicting similar patterns.

Tuesday, June 19, 2012

Day 7 - WK 2

Uploaded GPS data from RET participants and started looking at driving patterns and routes.  Jesse and I discussed how do we take the dat we have collected and put it in a format that we can begin looking at routes that are similar and where routes intersect and are duplicated.  We discussed van sharing which is offered through DART and the cost benefits associated with the program. I read several times in the literature research that one of the large social barriers to ridesharing seems to be the loss of time in schedules drivers are afraid of losing.  One study suggests that drivers will not be willing to rideshare if it creates a more than 10 minute deviation in their commute.  Looking at my own commute daily to UNT I see how drivers know their routes and plan their schedules without much flexibility, I know I can leave by 8:15 am and I will have time to stop for an iced tea or coffee and arrive at UNT by 9:00 am.  I know approximately how long it takes me during each portion of the trip and where I am most likely to see slowdowns and alternative routes as well.  I have also noticed other members of the RET stopping at the same location each morning as well.  I began to wonder if ridesharing even the last few miles would have a noticeable benefit in the carbon footprint over the 6 week period? Jesse and I worked with Jason to import some of the data into Excel and start looking at ways we can interpret the data and look for patterns and where tracks intersect. We will need to look at the difference between points using the time, date latitude and longitudes of tracks. After lunch we had a representative from National Instruments teach us how to use LabView and a myDAQ to do do an activity with Audio.

Monday, June 18, 2012

Day 6- WK 2


This morning we built a SNAP ROVER from the kit.  We want to test and determine what proximity our GPS data will need to be scaled to for out techfest idea, of having students travel around Denton to find the best rideshare routes using a combination of simulating the data using the rover and preloaded Google Earth routes. 


 We uploaded GPS files from 4 RET participants and converted them to .gpx files using GPSBabel.  We also spoke with Dr. Huang about our progress on the lessons and our research.  We are utilizing a shared dropbox folder to keep all our data and research within our research team.  Dr. Huang added some research files and suggested we begin looking at how and what programs we will need to analyze the data we have now began to collect. We are also going to begin looking at the social barriers students and society has with the concepts of ridesharing.  This afternoon we read article pertaining to several different ridesharing pilot programs and the barriers that they have faced with social issues and inconvenience for potential riders. 


 Some of these barriers will be less relevant as smartphones and our wireless infrastructures are improved.  I read about how cities must also look at how streets and streetscapes are constructed and designed to lessen the environmental impact in cities, such as drainage, trees, the number of cars in an area, and parking areas.

Friday, June 15, 2012

Day 5 - WK 1

This morning we had an overview of how to develop a lesson plan and a techfest idea for our project.  We also had an introduction to creating and maintaining a team blog by another RET teacher.  Jesse and I sat down to discuss what direction we wanted our techfest lesson to go, I remembered that the previous year’s techfest were attended by many younger students, so an activity that was very interactive and hands on would probably be our best option. We have an idea to use the snap rovers with the GPS for students to try and plot a route that will save the most CO2 and benefit the most people, by having them drive a route mapped out on the floor and then looking at their results and calculating how much energy they can save from the various routes that they chose. These routes could be pre setup in Google Earth so after they run the routes they can look at their data in a live format and possibly think and hypothesize other cost and energy saving methods of transportation.   


We also discussed that since Jesse teaches Algebra I and II and I teach Physics for freshman which is Algebra I based, we could create a lesson that utilizes compiling GPS data and doing calculations to save CO2 and or create ridesharing opportunities.  One issue is access to technology for every student, however we have discussed possible solutions for this.  Ideally I would like to turn this into a PBL project, where my students will take data, search for patterns and even design better routes or possible ride sharing opportunities and collaborative database for the student population at our campus to share.

During the afternoon we worked on the project notebook page logging our weekly information and data, and creating our blog which we will update with our daily progress.
Day 4 - WK 1

The RET teachers took a field trip to the WRFS in Denton to look at some of the research taking place at the station.


We had GPS trackers in each of the vehicles so that we can have data from each car that we took.  I uploaded the GPS from the trip in the afternoon and was looking at how it matched up nearly identically to the google map we had used for directions.

We also did research on how to you actually calculate a carbon footprint and can we isolate it to just transportation, and not factor in home energy usage.  There was some apps for smartphones and computer programs that help you calaculate your footprint and give suggestions to help you such as Stanford transportation calculator and icarpool which will actually calcuate your savings and CO2 reduction.  

Day 3 - WK 1

Today we began researching carbon footprints and studies about apps for smartphones and ridesharing.  I found that there are several small ridesharing apps in some of the larger metropolitan areas such as Los Angeles and Seattle.  One example is Avego. Another site I looked at was Zimride, which was started for college campuses in LA and SF.  There are nationwide ridsharing opportunities for not just commuting, but also traveling to other areas or states through erideshare.com. During lunch I traveled to Northwest HS to meet with my new principal.  Below you can actually see the track I took for the day, from my home in Decatur to Wal-Mart, through the drive-through for breakfast, to UNT, NHS,back to UNT and home.

Alex installed gpsbabel on the 2 computers that Kim and I are using in the lab B239. The SD was taken from the device and uploaded to Dropbox. We then used phpMyGPX link to upload and view the .gpx files using the map viewer and detail function. We also recognized that there’s a glitch using Microsoft Internet Explorer so we found Firefox and Google Chrome works just fine.
Day 2 - WK 1

Spent most of the morning looking at how the GT-31 operates and functions. We were having issues with the time and date functions being off by an hour, Jason was able to fix this.  Tried to upload files from the SD card.  Files had to be converted to a format usable to us in mapping the data so we had GPS Babel www.gpsbabel.org installed on our computers so that we counvert our GPS data files to .gpx format an upload them for shared usage among our group.  In the afternoon we were able to upload and view our GPS data on maps and view our tracks and well as see the errors and outlier data ( most of the time outliers were sharp points out and back in on the map)

Started researching how GPS systems work. Also, brainstormed on what we viewed as possible project deliverables for the RideShare group. Jason was also involved in the discussion. Jason was able to provide 2 additional 2GB SD memory cards for additional GT-31 usage. We now have capability for 8 trackers to be collection data.
Day 1-WK 1

Orientation and group dynamics were introduced.  Team members were able to meet and look at the goals for their project.  OUr group met with Dr. Huang and our graduate student mentor Jason about what the goal of of our project was.  Terry introduced us to the GT-31 GPS tracker and we set them up to collect GPS data for mining and analysis. We learned about the basics of ridesharing and how the mean occupancy per vehicle is 1.6 persons per vehicle mile in the US.

Read online documents/manuals for additional understanding and configurations of the GT-31 GPS tracker. Met with Dr. Huang in the lab. Jason and Terry  provided an overview of the RideShare research statement. Also, Dr. Huang mentioned ways data is being captured using taxis in Shanghai. After configuring the GT-31’s we found that an SD card no larger than a 2GB would be recognized by the devices.  


This is an image of the GPS trackers we are using: